
Flask application monitoring with Prometheus
Intro
Prometheus is an open source project that is part of the Cloud Native Computing Foundation(CNCF). It serves as a monitoring system and time series database. The project was second to be part of CNCF after Kubernetes. As such the two project play really nicely with one another.
In this post I'll take us through using Kubernetes(K8s for short) as our deployment platform for Prometheus, then setting up a simple python app for monitoring. I recommend checking out my previous post on standing up K8s on AWS first, here. Otherwise if you already have a K8s cluster, lets get started.
Prerequisites
- A running Kubernetes cluster
- Configured kubectl client
Architecture
Not going to do a complete architecture run through here, but I want to mention some of the basics.
Prometheus takes a particular stance on how it goes about monitoring. Most monitoring systems out there rely on the use of an agent, that sits on the client machine. This agent will gather metric from the host and shoot them over to the monitoring system. This can be seen as a push method.
Prometheus takes more of a pull method to this. The idea behind this is that you tell Prometheus what it needs to monitor, and it will go out and start scraping that endpoint for metric.
This approach provides a lot of flexibility as application KPIs can be added/modified/removed very quickly and provides a modern devops approach to application monitoring. It also means application monitoring is driven by the individuals/teams who understand the application(to be monitored) best.
Jump in
If you want to jump straight in, deploy the following in your k8s cluster:
-
python-app - simple python app that incorporates Prometheus monitoring. Metrics provides by app: request_processing_seconds, index_request_processing_seconds, requests_for_host.
-
Prometheus - The official Prometheus image.
-
Assets - All assets described in the post can be retrieved from this repo
Deploy Prometheus
Deploying Prometheus into K8s is super easy. Lets take a look at the deployment file deployment.yml.
apiVersion: extensions/v1beta1
kind: Deployment
metadata:
  name: prometheus-deployment-1.7.1
spec:
  replicas: 1
  template:
    metadata:
      labels:
        app: prometheus-server
    spec:
      containers:
        - name: prometheus
          image: prom/prometheus:v1.7.1
          args:
            - "-config.file=/etc/prometheus/conf/prometheus.yml"
            # Metrics are stored in an emptyDir volume which
            # exists as long as the Pod is running on that Node.
            # The data in an emptyDir volume is safe across
            # container crashes.
            - "-storage.local.path=/prometheus/"
          ports:
            - containerPort: 9090
          volumeMounts:
            - name: prometheus-config-volume
              mountPath: /etc/prometheus/conf/
            - name: prometheus-storage-volume
              mountPath: /prometheus/
      volumes:
        # The config map we will create then bind to our volume mount.
        - name: prometheus-config-volume
          configMap:
            name: prometheus-server-conf
        # Create the actual volume for the metric data
        - name: prometheus-storage-volume
          emptyDir: {} # containers in the Pod can all read and write the same files here.
Before we deploy this let first create the configmap for the prometheus config. A configmap is a way we can decouple and store configuration files for use in different deployments. Lets looks at the prometheus.yml config.
global:
  scrape_interval: 5s
  evaluation_interval: 5s

scrape_configs:
  - job_name: 'prometheus'
    static_configs:
      - targets: ['localhost:9090']

  - job_name: 'python-app'
    kubernetes_sd_configs:
      - role: pod
    relabel_configs:
      - source_labels: [__meta_kubernetes_pod_label_app]
        regex: python-app
        action: keep
Here we have setup two scrape jobs. One is simply telling Prometheus to scrape itself. The other is scraping our example python-app. Take notice of the kubernetes_sd_configs directive, very handy for using the kubernetes api to find scrape targets. Here we are using the pods role to discover all pods with an app label of 'python-app'. Also it is worth mentioning that by default Prometheus will scrape the /metrics endpoint unless stated otherwise.
We can create the configmap like so:
kubectl create configmap prometheus-server-conf --from-file=prometheus.yml
Now that we have created that we can create our prometheus deployment.
kubectl create -f deployment.yml
Once you have deployed Prometheus you will be able to see your deployment via
kubectl get deploy
NAME                          DESIRED   CURRENT   UP-TO-DATE   AVAILABLE   AGE
prometheus-deployment-1.7.1   1         1         1            1           40s
Now that Prometheus has been deployed, we need a method of accessing it. For this we will need to create a service(svc). A service manifest file looks like so:
apiVersion: v1
kind: Service
metadata:
  name: prometheus-service
spec:
  selector: # exposes any pods with the following labels as a service
    app: prometheus-server
  type: NodePort
  ports:
    - port: 80 # this Service's port (cluster-internal IP clusterIP)
      targetPort: 9090 # pods expose this port
      # Kubernetes master will allocate a port from a flag-configured range (default: 30000-32767),
      # or we can set a specific port number (in our case).
      # Each node will proxy 32514 port (the same port number on every node) into this service.
      # Note that this Service will be visible as both NodeIP:nodePort and clusterIp:port
      nodePort: 32514
We can deploy a service in a similar fashion as the deployment:
kubectl create -f svc.yml
Now that we have a service for prometheus we can access it simply by hitting the node on port 32514 as we specified. Take note, if you are using aws then use the public ip of the instance (make sure your security group allows you access over this port).
Deploy Python-app
Now that Prometheus has been deployed we can now deploy our simple python app and start scraping some metric in. Our deployment file my-app.yml:
apiVersion: extensions/v1beta1
kind: Deployment
metadata:
  name: python-app
spec:
  replicas: 1
  minReadySeconds: 5
  strategy:
    type: RollingUpdate
    rollingUpdate:
      maxUnavailable: 1
      maxSurge: 1
  template:
    metadata:
      labels:
        app: python-app
    spec:
      containers:
      - name: python-app
        image: vect0r/python-app:latest
        ports:
        - containerPort: 5000
          name: web-app
Lets deploy this:
kubectl create -f my-app.yml
As before we'll create a service manifest, my-app-svc.yml:
apiVersion: v1
kind: Service
metadata:
  name: my-app-svc
spec:
  selector: # exposes any pods with the following labels as a service
    app: python-app
  type: NodePort
  ports:
    - port: 5000 # this Service's port (cluster-internal IP clusterIP)
      targetPort: 5000 # pods expose this port
Notice here we haven't specified a nodePort. Kubernetes will pick one out for us. Create the service:
kubectl create -f my-app-svc.yml
kubectl get svc
NAME                  CLUSTER-IP      EXTERNAL-IP   PORT(S)                         AGE
prometheus-service    100.69.192.22   <nodes>       80:32514/TCP                    13d
my-app-svc            100.69.92.128   <nodes>      5000:32455/TCP   12d
Listing the services displays the nodePort selected, we can see the python app can be accessed on 32455. Remember back when we created our configmap for prometheus. We specified in our config to find pods with the 'python-app' app tag and scrape them. Hence now we have done this we should see the following targets in Prometheus.

App monitoring
We have two views we are monitoring in our web app. These are the '/' and '/host' endpoints. Lets take a look at our index view:
# Create a metric to track time spent and requests made.
INDEX_TIME = Summary('index_request_processing_seconds', 'DESC: INDEX time spent processing request')

# Create a metric to count the number of runs on process_request()
c = Counter('requests_for_host', 'Number of runs of the process_request method', ['method', 'endpoint'])

@app.route('/')
@INDEX_TIME.time()
def hello_world():
    path = str(request.path)
    verb = request.method
    label_dict = {"method": verb,
                 "endpoint": path}
    c.labels(**label_dict).inc()

    return 'Flask Dockerized'
This block of the code is doing serveral things, firstly we are creating a Summary metric type. This is one of the metric type the prometheus_client supports. The first parameter is the name of the metric, the second is a description text for the metric. The second metric we create is a Counter, similar to the Summary the first two parameters are name and description. However a third parameter is provided, this allows us to provide tags to differentiate targets. Think of it as allowing you to create another line on the graph.
Then we create our view using the flask decorator, notice we also use INDEX_TIME as a decorator and using the time() method to give us the time taken to execute this method. The view itself is just returning 'Flask Dockerized' to the webpage, however note that we are using flask to get the path requested and the HTTP verb used. We save this to a dictionary and pass it through to our counter.
Expose metrics
How do we expose this to Prometheus? Well as mentioned before the Prometheus by default looks at the /metrics endpoint for all it's scraping. So lets build that endpoint into our app.
@app.route('/metrics')
def metrics():
    return Response(generate_latest(), mimetype=CONTENT_TYPE_LATEST)
What we have done here is simply used Flask's routing mechanism to create the metrics endpoint. This view is returning a Flask Response object. the generate_latest() method is provided by the Prometheus client and this will provide a string with all the metrics defined in the app and their values, in the Prometheus standard. We wrap this in the Response object that is passed back to the client. Output looks like below:
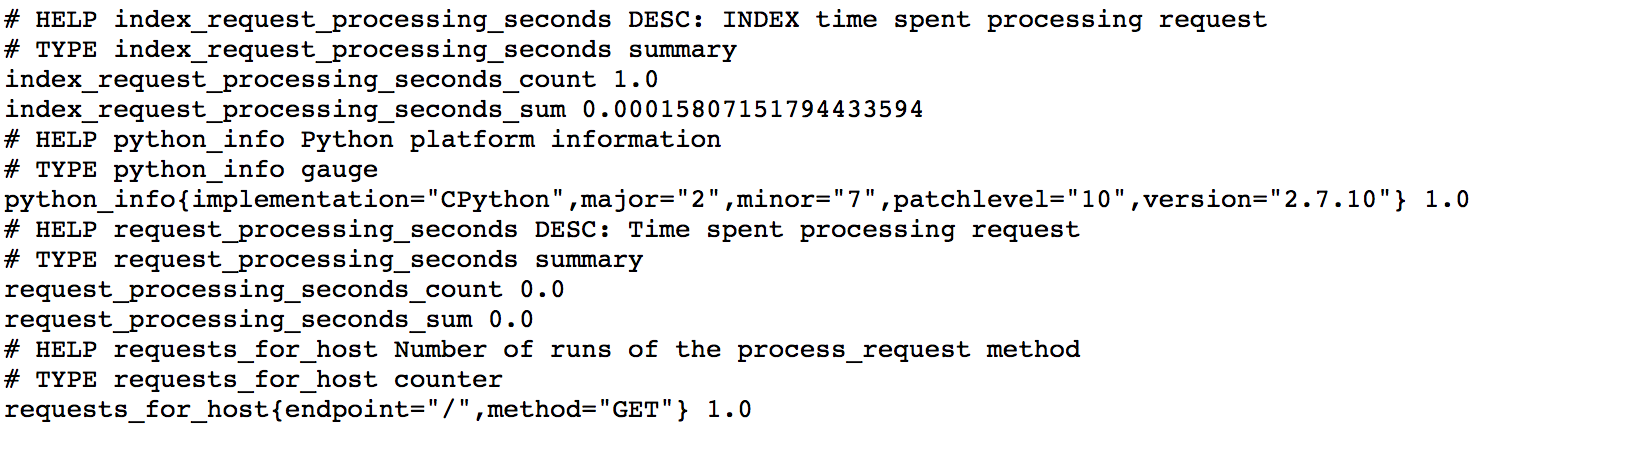
Every time Prometheus scrapes this app, this block of code will run providing Prometheus with the latest metrics values, which it stores in its TSDB.
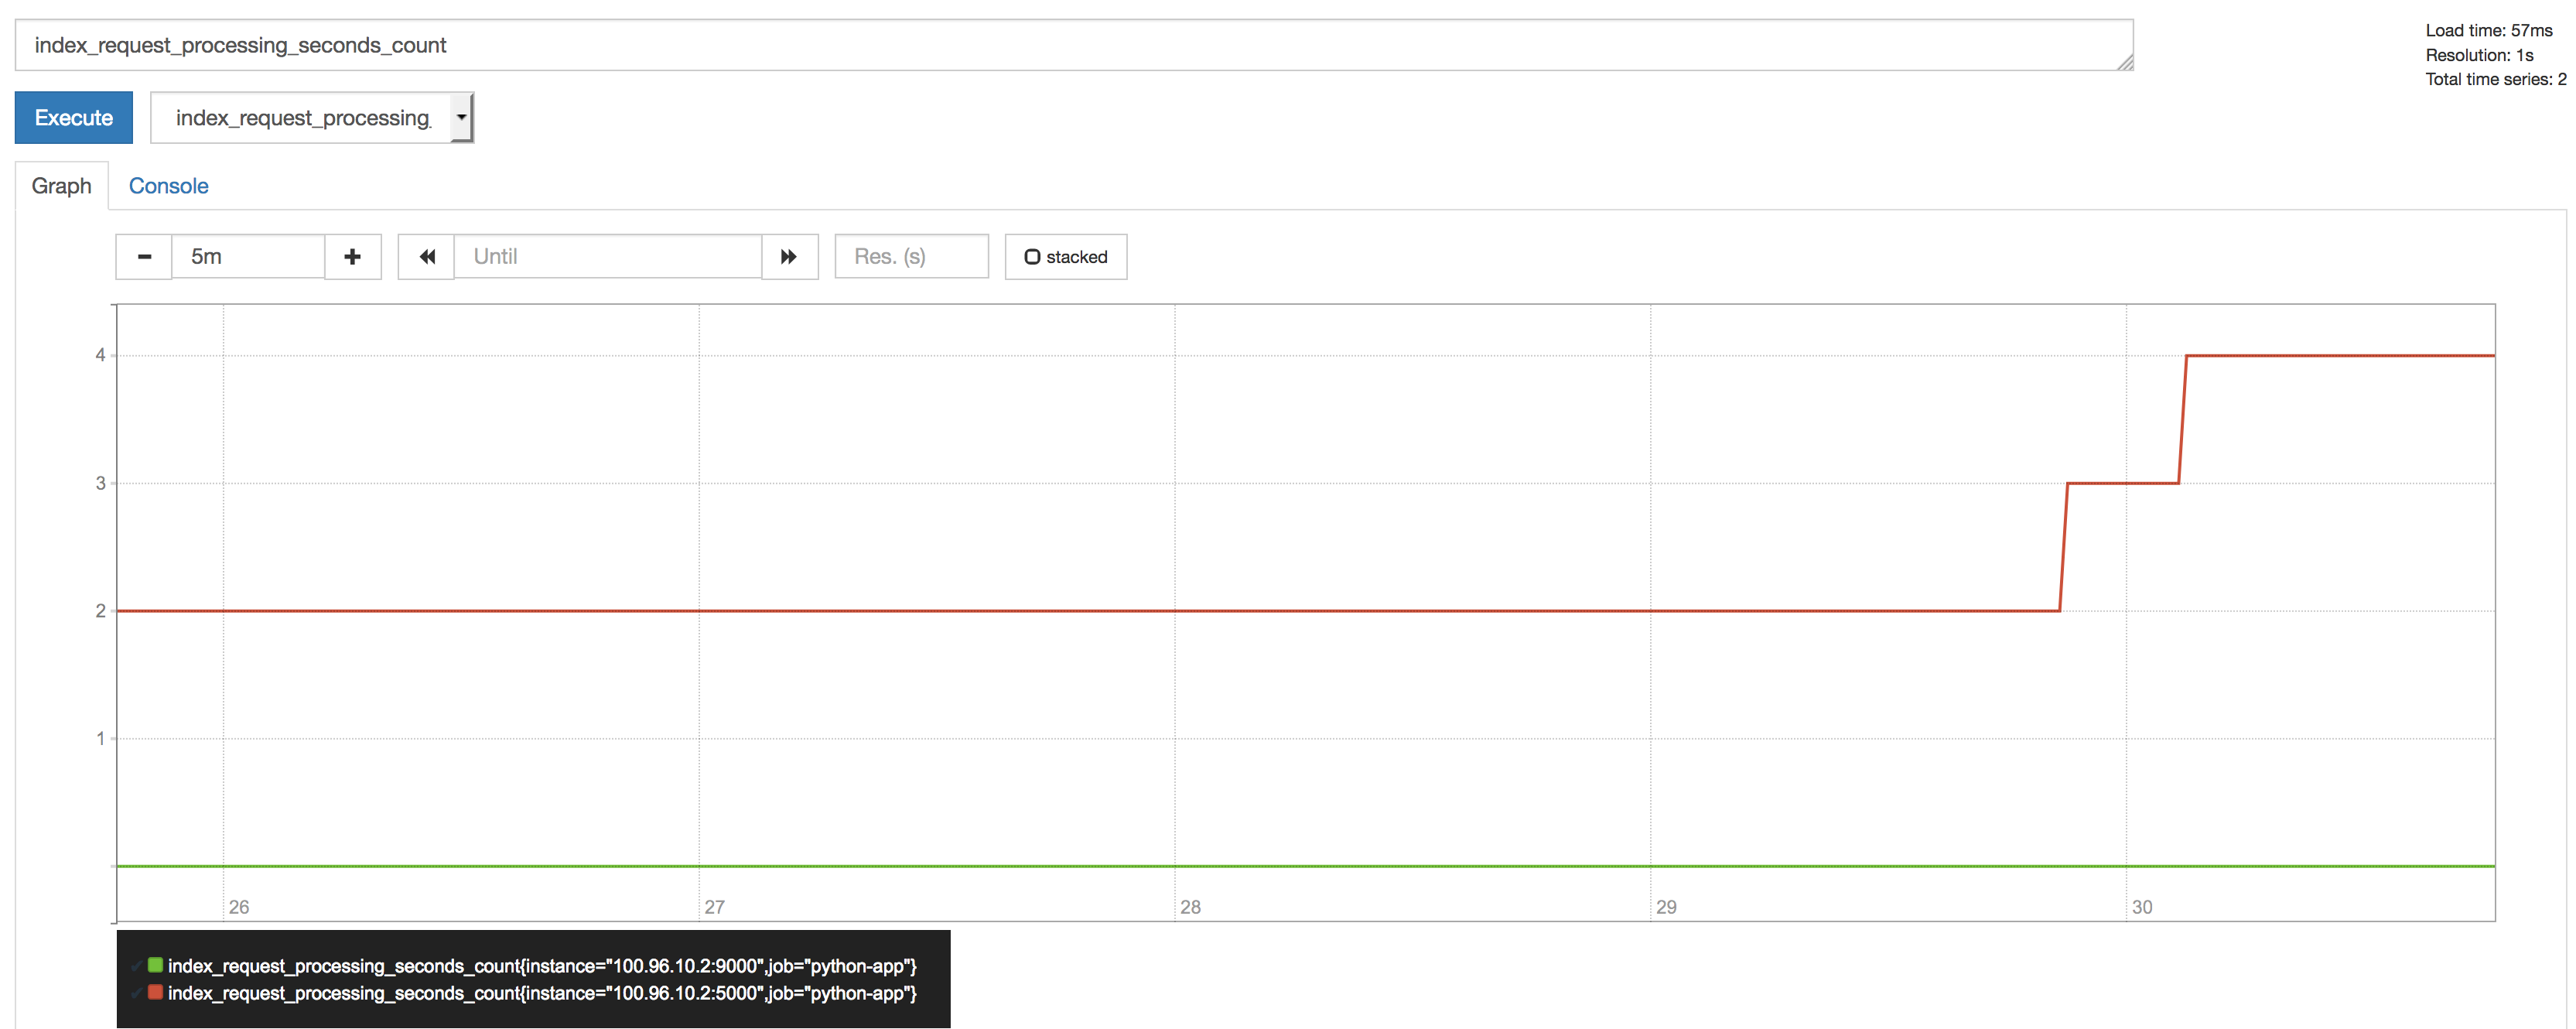
Graph in action
Lets take a look at what the code does for us. Navigate to your Prometheus UI and search on our metric 'index_request_processing_seconds', you will notice there is a count and sum. Every time you hit the index endpoint you will see both these metrics change. The count will show you how many times the view has been called, the sum will show you the total execution time taken by this method. You can see this in action below:
The Counter metric we created can be found by searching requests_for_host.
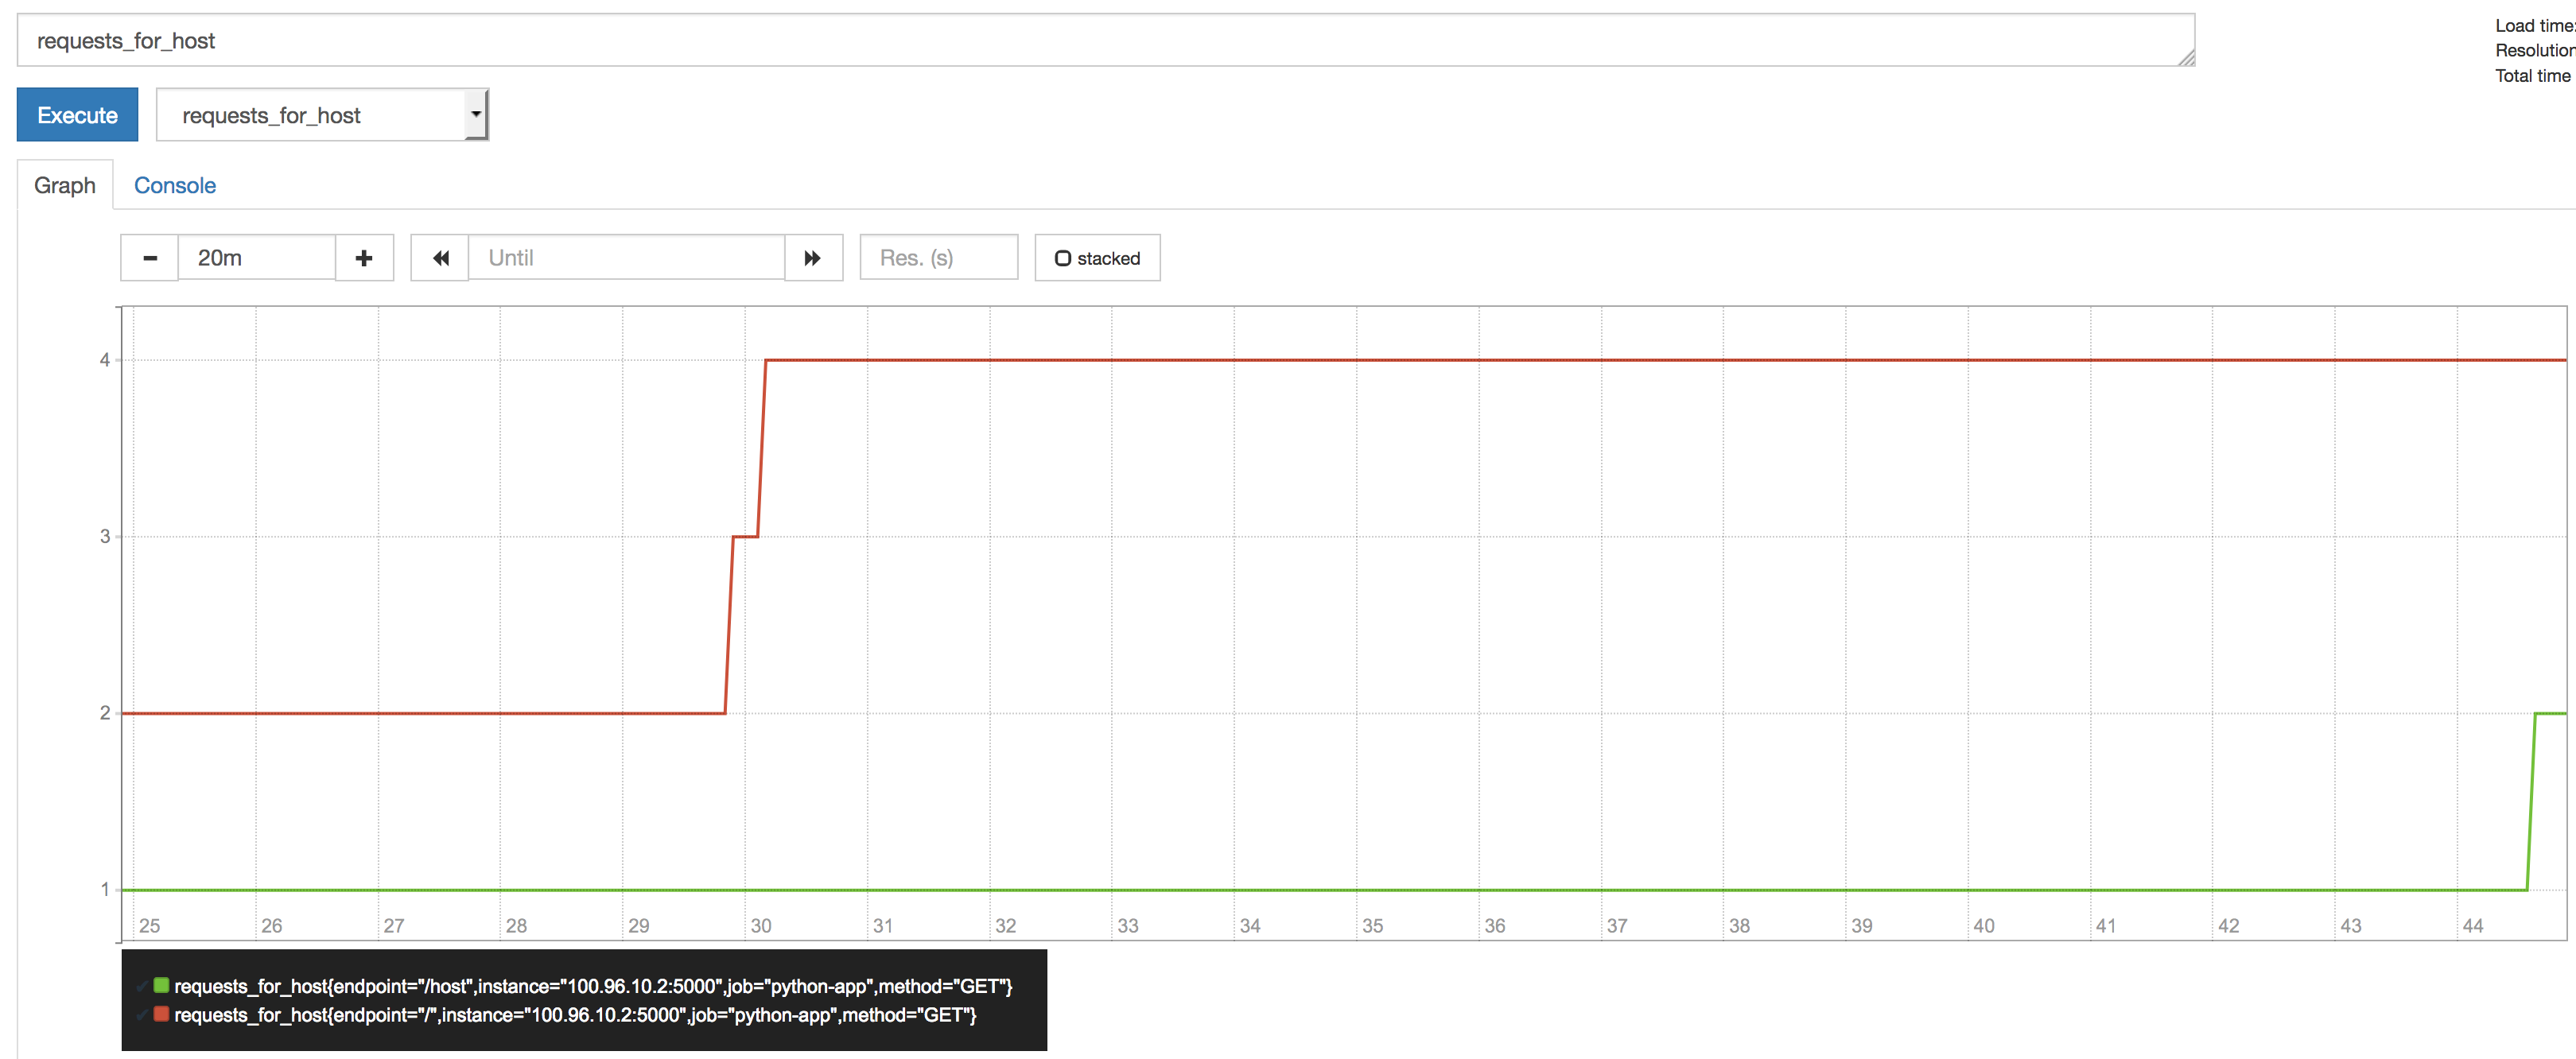
Here notice we have two lines one for our '/index' view and another for our '/hosts' view.
Wrap up
So we've gone go over deploying Prometheus on Kubernetes and using the Prometheus_client to monitor our app. This has only scratched the surface of what you can do. I hope this has help you kick start your use of Prometheus.